A monthly reliability report brings together a large amount of operational information into a relatively small number of indicators.
Behind those indicators are flight records, defects, technical delays, component removals and maintenance findings. Once the report is prepared, Reliability Engineering still needs to understand which aircraft, ATA chapters, systems or components are driving the result.
This is where the monthly reliability workflow moves from reporting into engineering analysis.
In this walkthrough, we follow that process inside EXSYN Reliability Intelligence: from the M&E data feeding the indicators, through the configured monthly report, to the dashboards and drill-downs used during reliability review.
For a closer look at the preparation work that happens before the report is ready, read Why Monthly Reliability Reporting Still Takes Days Instead of Hours.
1. Start With the Operational Records Behind the Indicators
The workflow begins with information already available from the operator's M&E environment.
Flight records provide the utilisation behind reliability rates. Pilot, maintenance and cabin defects feed defect analysis. Delays and cancellations support technical dispatch reliability. Component removals are used for removal rates, MTBUR and MTBF. Maintenance programme findings provide another view of task effectiveness.
These datasets are connected because the resulting indicators depend on one another.
A defect rate, for example, needs the correct defect population and the corresponding utilisation. Component reliability needs removal history together with flight hours or cycles. Technical dispatch reliability depends on both operational events and their technical classification.
EXSYN works alongside the M&E system rather than replacing it. The M&E system remains the system of record while the reliability apps use its operational data for validation, reporting and analysis.
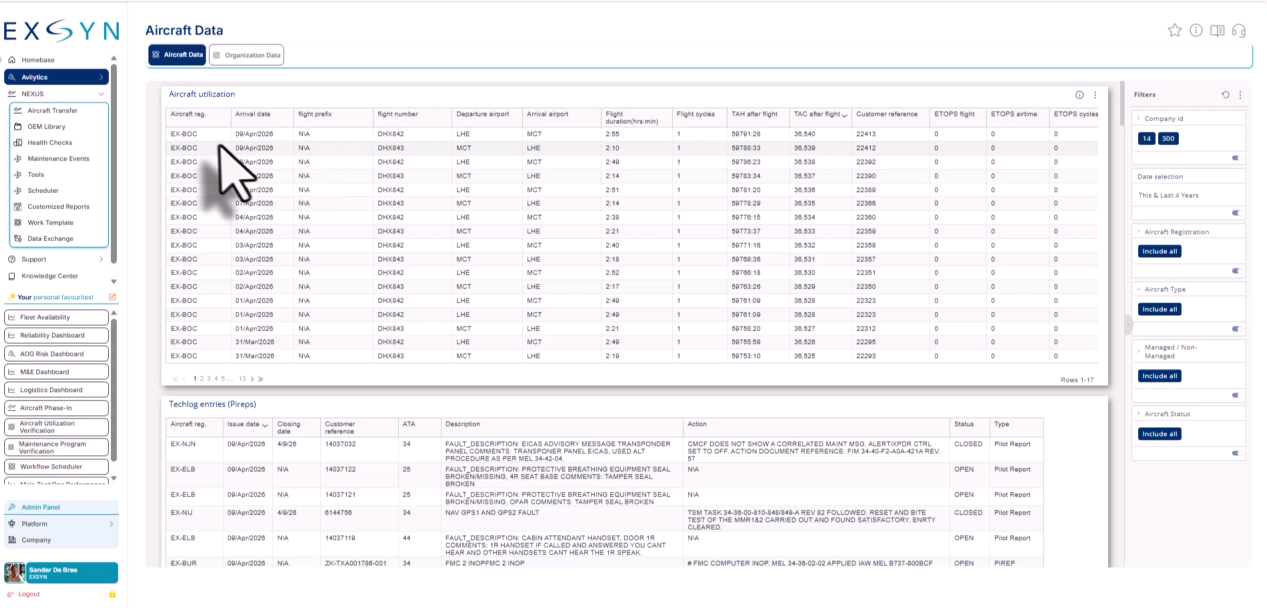
Reliability reporting starts with the operational records already available from the airline's M&E environment.
2. Check the Data Before It Becomes a Reliability Indicator
Before the monthly indicators are reviewed, the records feeding them need to make operational sense.
Within the Reliability Intelligence package, M&E Consistency Checks & Reports provides this data-foundation layer. Utilisation checks can surface exceptions such as out-of-sequence station or TAC/TAH records, zero-duration flights, suspicious cycles, minutes or flight durations.
The purpose is to bring questionable records to Engineering's attention before they influence the monthly indicators.
The check itself does not decide what happened operationally. The relevant team reviews the exception and resolves the underlying record where necessary.
This creates a more consistent starting point for the monthly reporting cycle.
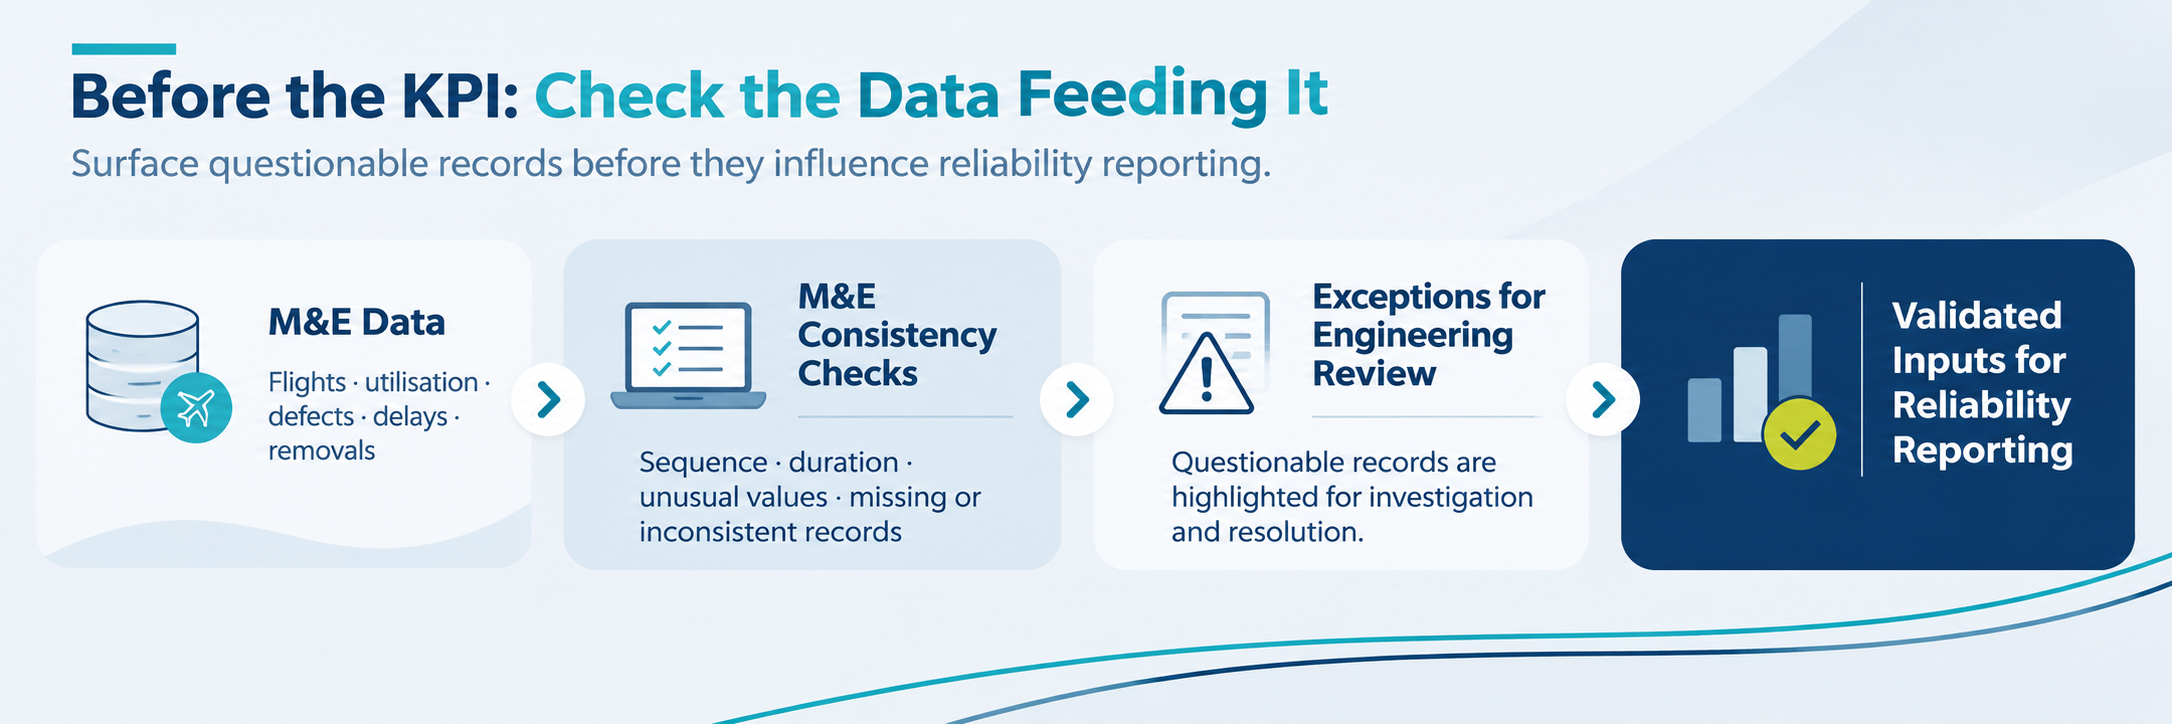
Consistency checks surface questionable records for review before they feed the monthly reliability indicators.
3. Build the Monthly Report Around the Reliability Programme
Once the reporting data is available, Reliability Reporting brings the indicators into a configured monthly technical fleet reliability report.
In the demo, the reporting environment allows the user to work with a defined report structure and filter the information by parameters such as reporting period, aircraft type, aircraft registration and operator.
The report itself can contain the sections required for the operator's reliability programme rather than forcing every fleet into the same fixed format.
The important part is repeatability.
Once the report and calculation logic are configured, the same process can be applied from one reporting period to the next. This helps maintain comparability between months and reduces the need to rebuild the report manually each time.
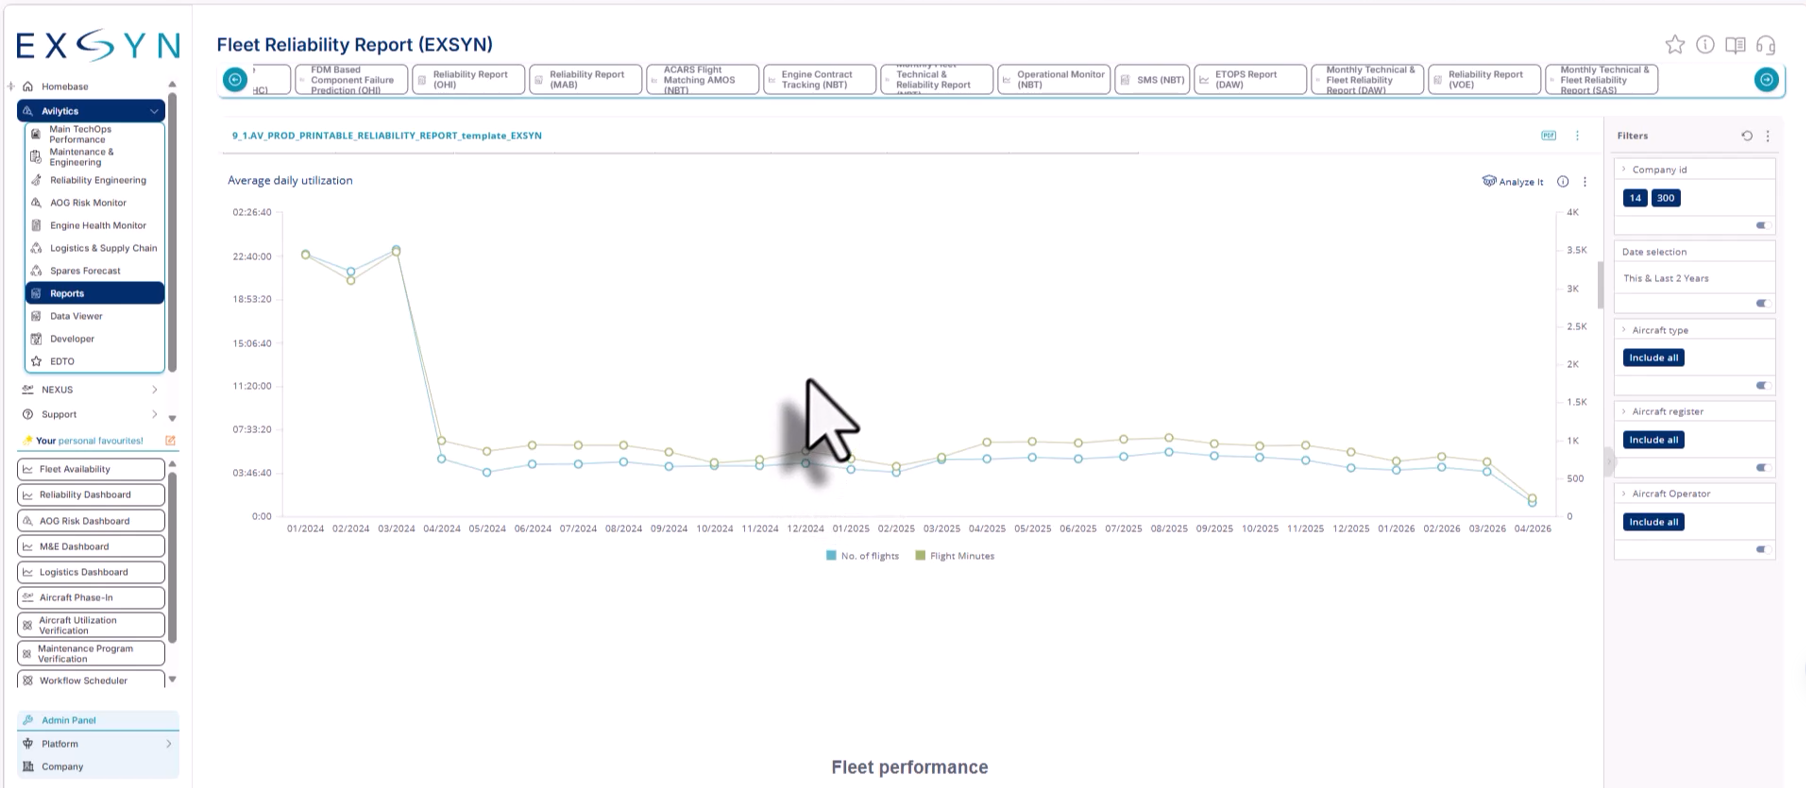
A configured monthly technical and reliability report brings the selected indicators into one repeatable reporting structure.
4. Bring Delays, Defects and Components Into the Same Review
A reliability report becomes more useful when Engineering can move beyond the headline KPI and see what sits behind it. The demo shows several examples.
Technical delays
The report can display disruptions by delay code and technical delays by ATA chapter.
Instead of looking only at an overall dispatch-reliability figure, the engineering team can identify which technical areas contribute most strongly to operational disruption.
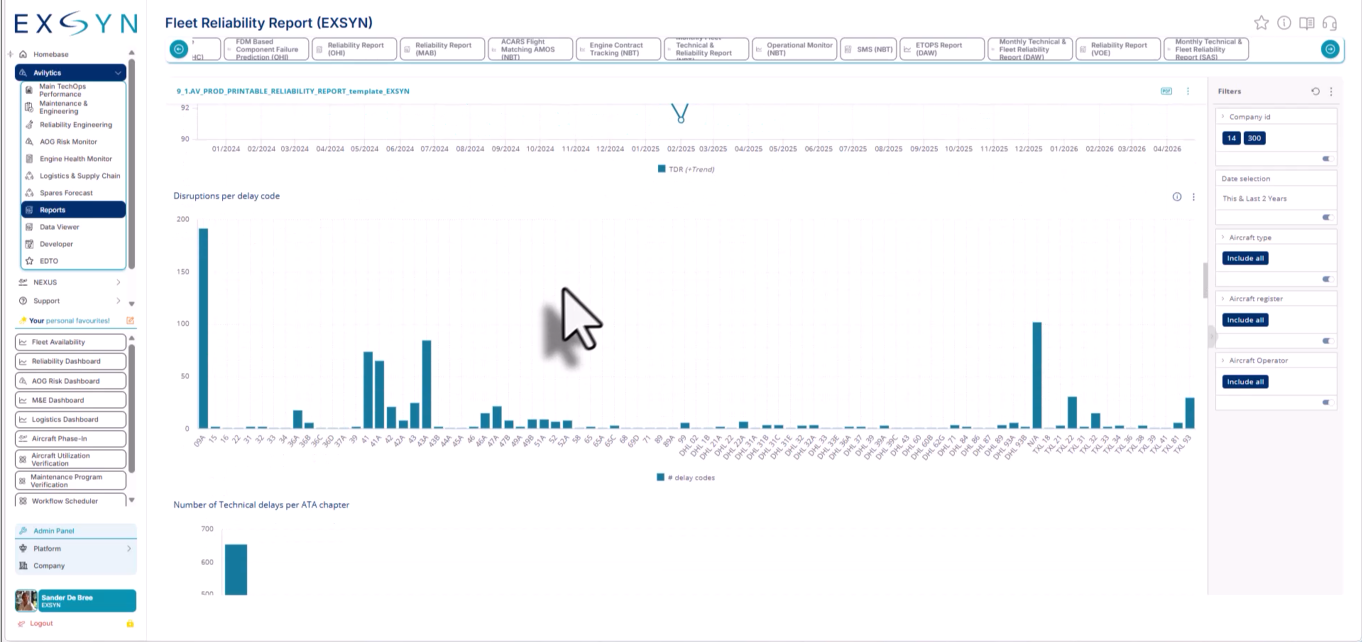
Component removals
Component performance can be reviewed through views such as unserviceable-removal counts and MTBUR-related changes.
The demo also shows ranked component-removal information, helping Engineering identify parts with higher removal activity or changing performance.
Defects
Defect information can be viewed by aircraft type as well as over time. For example, the monthly report can show how MEL defects develop across reporting periods, helping the team identify changes that deserve closer investigation.
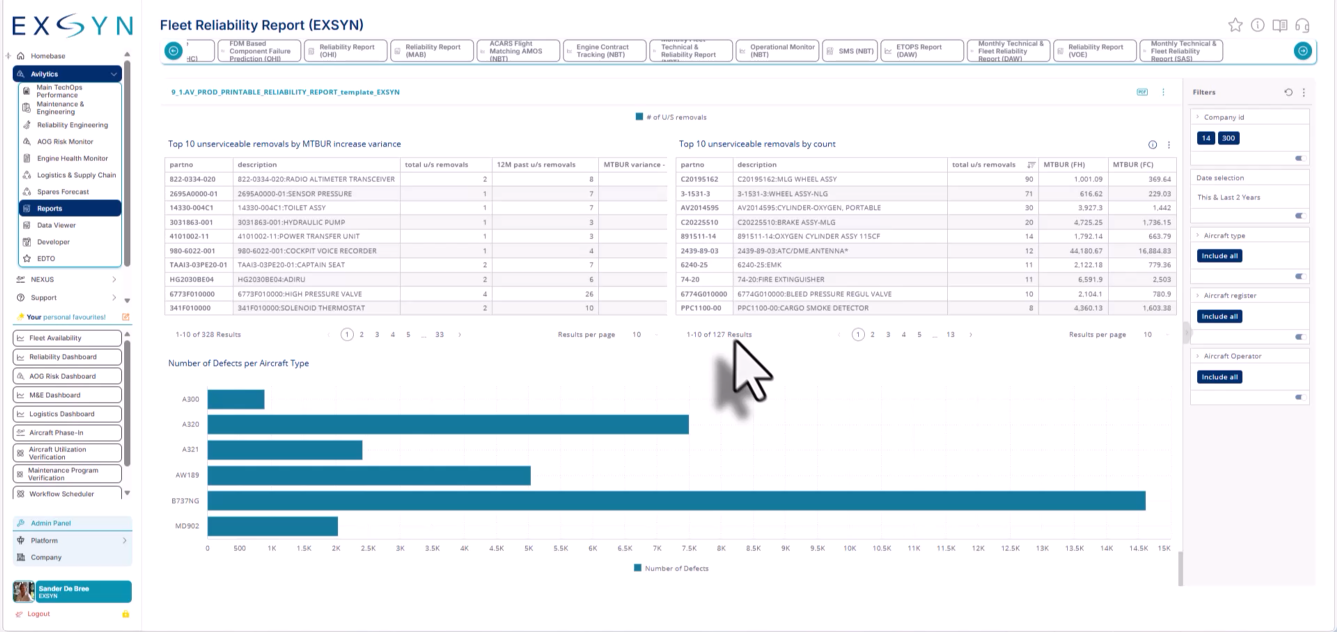
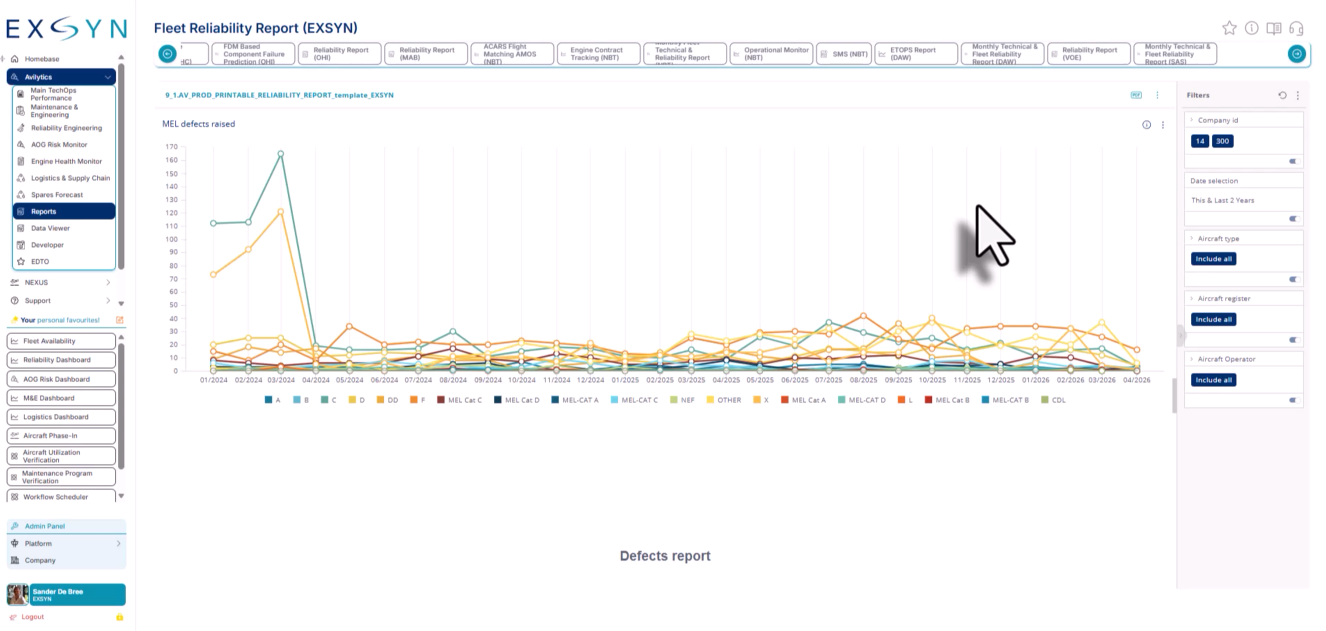
The value of these views is not simply having more charts. It is being able to move from the overall reliability result toward the operational events contributing to it.
5. Use the Reliability Dashboard as the Starting Point for Investigation
Once the monthly reporting picture is available, Reliability Analysis provides the next layer.
The main Reliability Dashboard brings several fleet-level signals together in one place.
In the demo, this includes views such as:
the main ATA contributors to fleet reliability;
rising variances compared with the previous period;
technical dispatch reliability;
ATA drivers behind technical delays;
significant technical events;
PIREP and MAREP trends;
cabin-defect trends; and
unscheduled-removal trends.
This gives the Reliability Engineer a starting point for the review.
Rather than opening separate datasets to determine where the main changes occurred, the dashboard indicates which areas deserve further investigation.
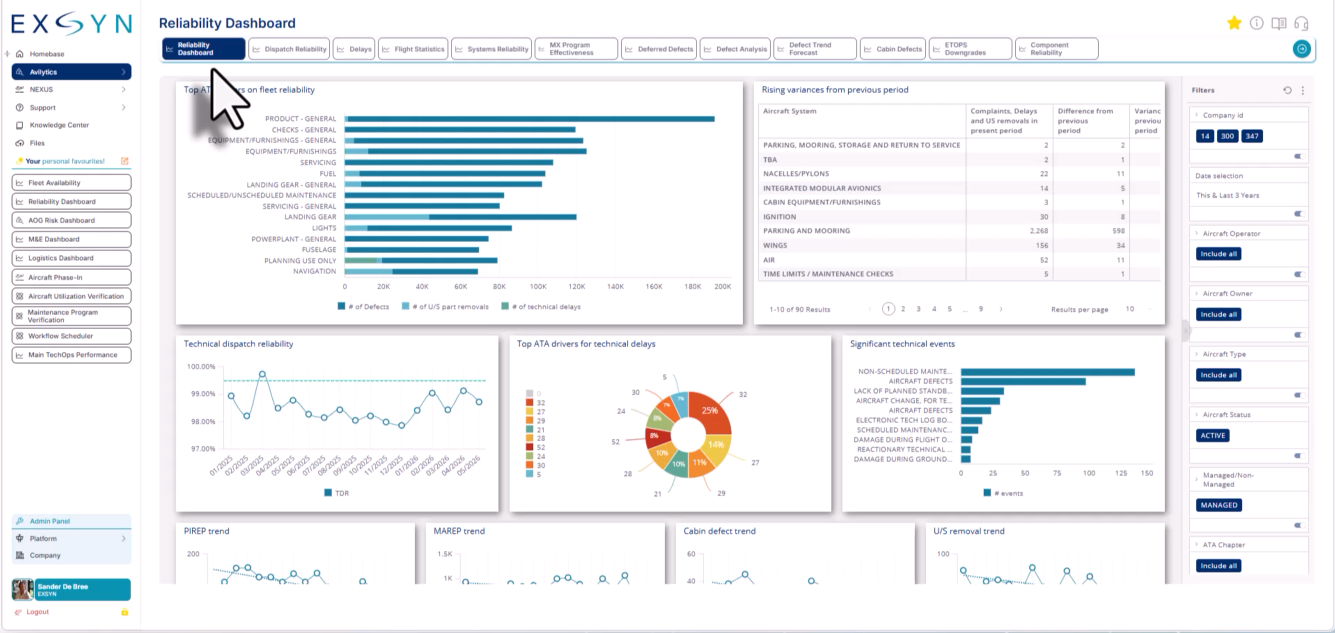
The Reliability Dashboard provides a fleet-level starting point before Engineering drills into the aircraft, ATA chapter, system or component behind the trend.
6. Drill Down According to the Engineering Question
A fleet-level signal is useful, but it rarely provides the complete technical explanation. Reliability Analysis therefore allows the user to move into more specific areas depending on the question being investigated.
Systems Reliability
The Systems Reliability view brings defect and finding information together by ATA chapter.
In the demo, Engineering can review the number and type of findings across ATA chapters and compare finding rates over time.
This helps answer questions such as:
Which systems are generating the most findings?
Has the rate changed from previous periods?
What types of reports are contributing to that ATA chapter?
Is the change fleet-wide or concentrated in a specific area?
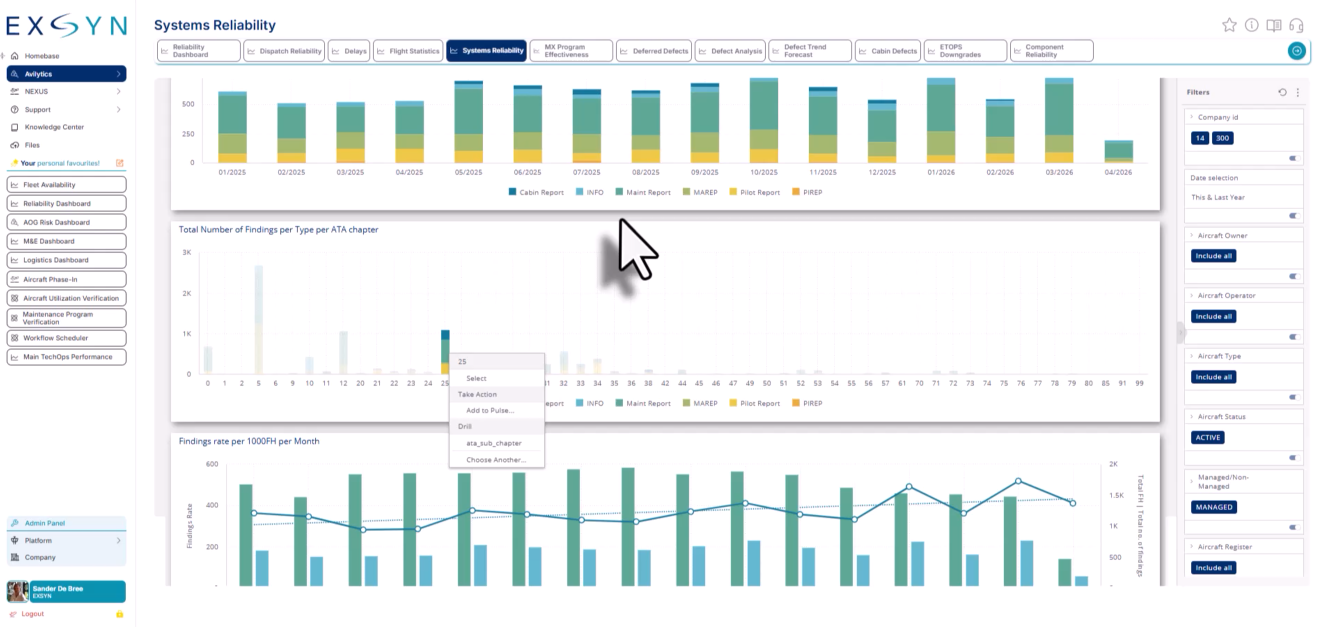
Systems Reliability brings findings together by ATA chapter and shows how finding rates develop over time.
Component Reliability
Component Reliability shifts the analysis from system-level findings to removal performance.
The demo includes views for:
unscheduled removals by ATA chapter;
unscheduled-removal rate per 1,000 flight hours;
scheduled versus unscheduled removal reasons; and
the distribution of unscheduled-removal reasons.
This allows Engineering to identify where component performance deserves closer review without relying only on a fleet-wide removal total.
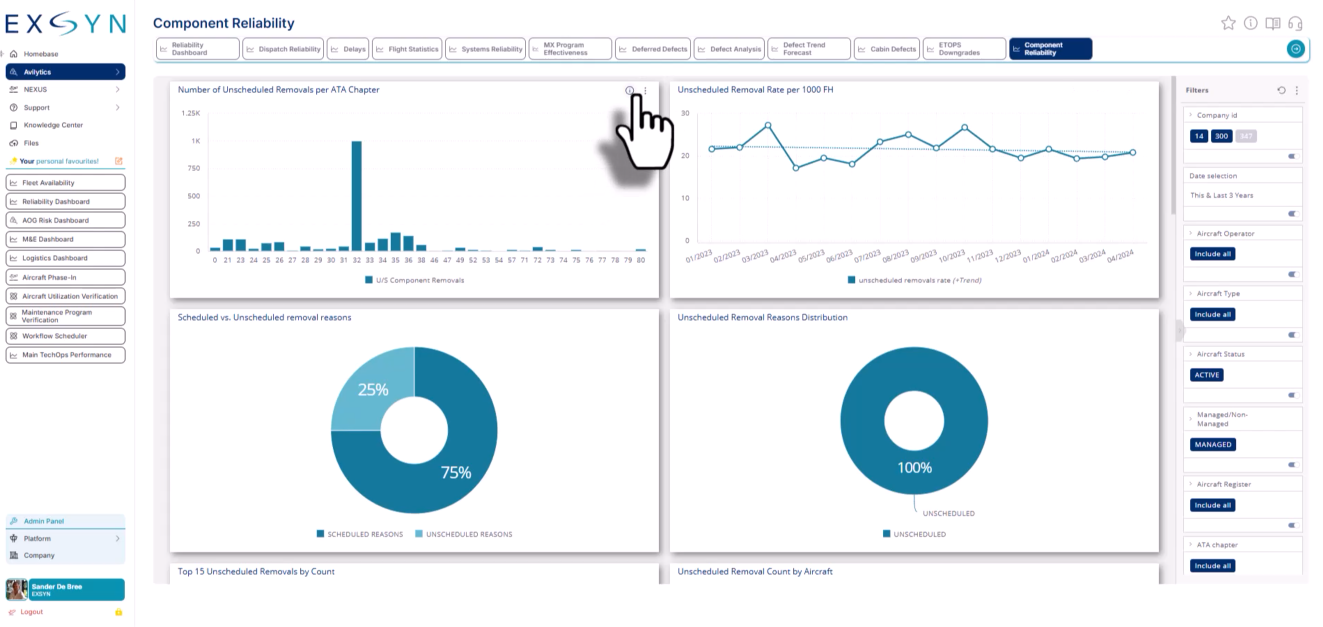
Component Reliability highlights unscheduled removals, removal rates and removal reasons across the fleet.
Maintenance Programme Effectiveness
Reliability review also supports decisions around the maintenance programme.
The MX Program Effectiveness view shown in the demo brings together maintenance programme task distribution, task intervals, unscheduled maintenance activity by ATA chapter and supporting task-level information.
This gives Reliability Engineering a structured basis for reviewing whether scheduled tasks continue to deliver the expected findings and where task performance may deserve further assessment.
The application can surface candidates for interval escalation or de-escalation. The engineering assessment and any decision to change the maintenance programme remain with the operator.
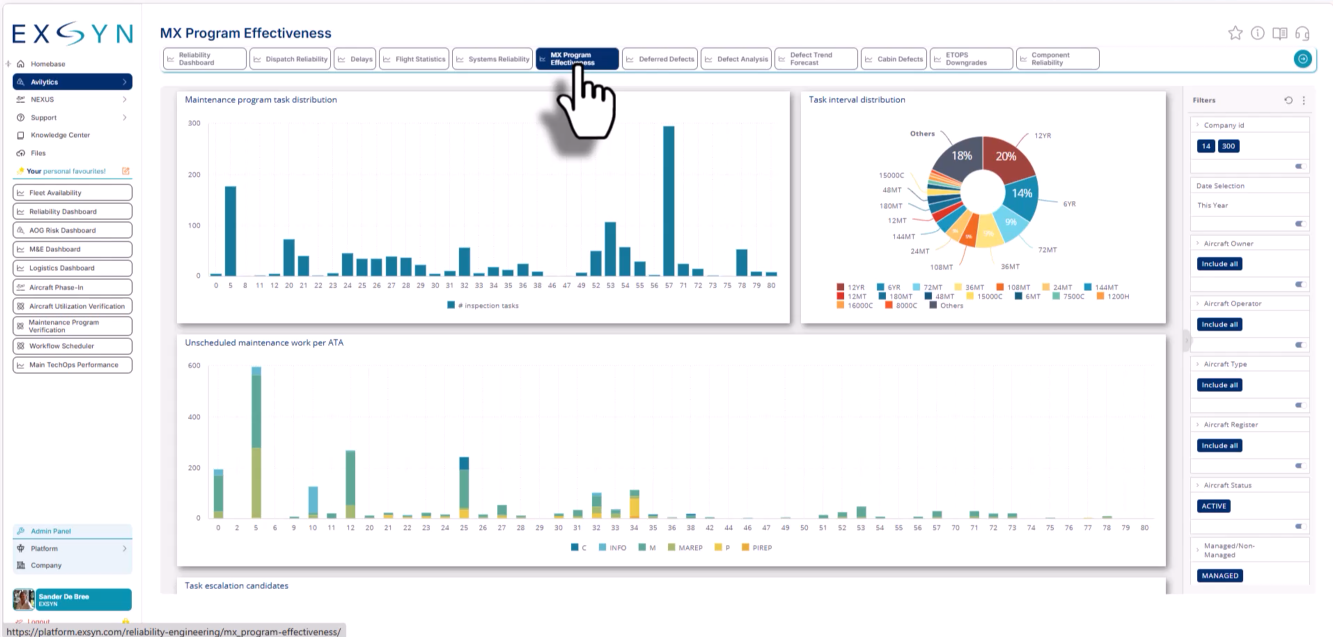
MX Program Effectiveness combines task distribution, task intervals and unscheduled maintenance activity to support maintenance programme review.
7. Move From the Indicator to the Engineering Question
This is the distinction between producing a reliability report and using reliability information. A monthly report may show that a defect rate has increased. Reliability analysis allows Engineering to ask:
Which ATA chapter is responsible?
Which aircraft are contributing?
Are the events repetitive?
Have technical delays increased in the same area?
Are component removals showing a similar pattern?
Does the maintenance programme provide evidence that should be reviewed?
The application provides the views and underlying information needed to investigate those questions. It does not determine the technical conclusion.
Engineering remains responsible for root-cause assessment, corrective actions, programme changes and the conclusions presented to the reliability review board or authority.
From Reporting to Reliability Intelligence
The monthly reliability workflow can be viewed as a connected sequence:
Collect → Reconcile → Validate → Prepare → Analyse → Act
EXSYN supports the repeatable work around collecting and reconciling information, validating the data, calculating indicators, preparing the report and surfacing areas that deserve investigation.
Reliability Engineering then applies the technical judgement. That distinction is important. The objective of Reliability Intelligence is not simply to create another dashboard. It is to give engineers a consistent path from the operational records in the M&E environment to the reliability questions that require their attention.
When the same validated information supports both reporting and analysis, the monthly report becomes the starting point for the engineering review rather than the end of the reporting exercise.
See the Reliability Intelligence Workflow in Action
Explore how EXSYN Reliability Intelligence brings together data validation, monthly reliability reporting, and engineering analysis while keeping your existing M&E system at the centre of the process.