
Reliability Reporting App
Reliability Reports Without the Manual Work
Automate reporting so you spend less time in spreadsheets and more time in real analysis.
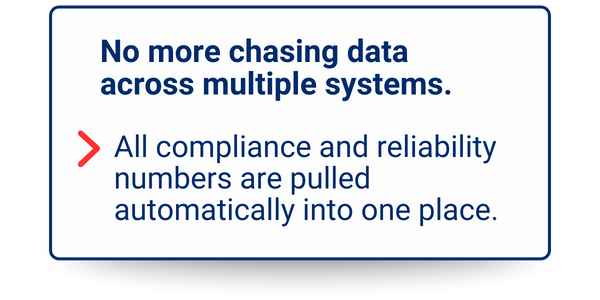
Eliminate spreadsheets and double-checks.
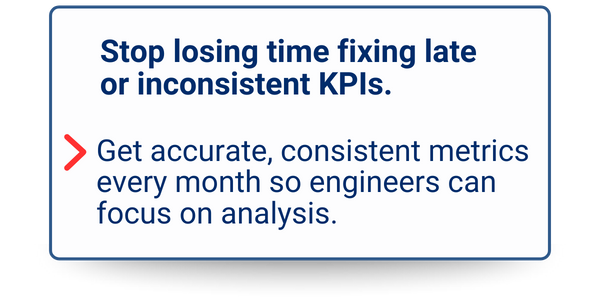
Automate KPI tracking.
free up time for real analysis.
Deliver trusted insights on time, every month
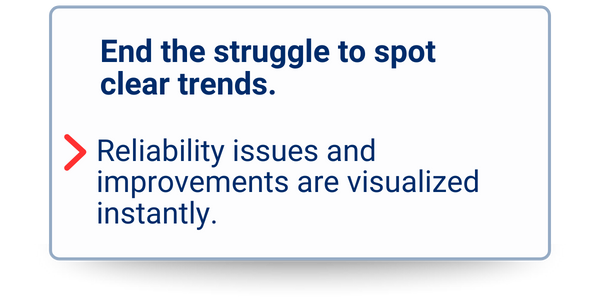
Solving the Daily Reliability Reporting Headache
Manual reporting slows down CAMO teams, risks errors, and delays insights.
The Reliability App eliminates the most common frustrations.
Built for Everyday CAMO Reality
Turning repetitive reporting into a fast, automated process
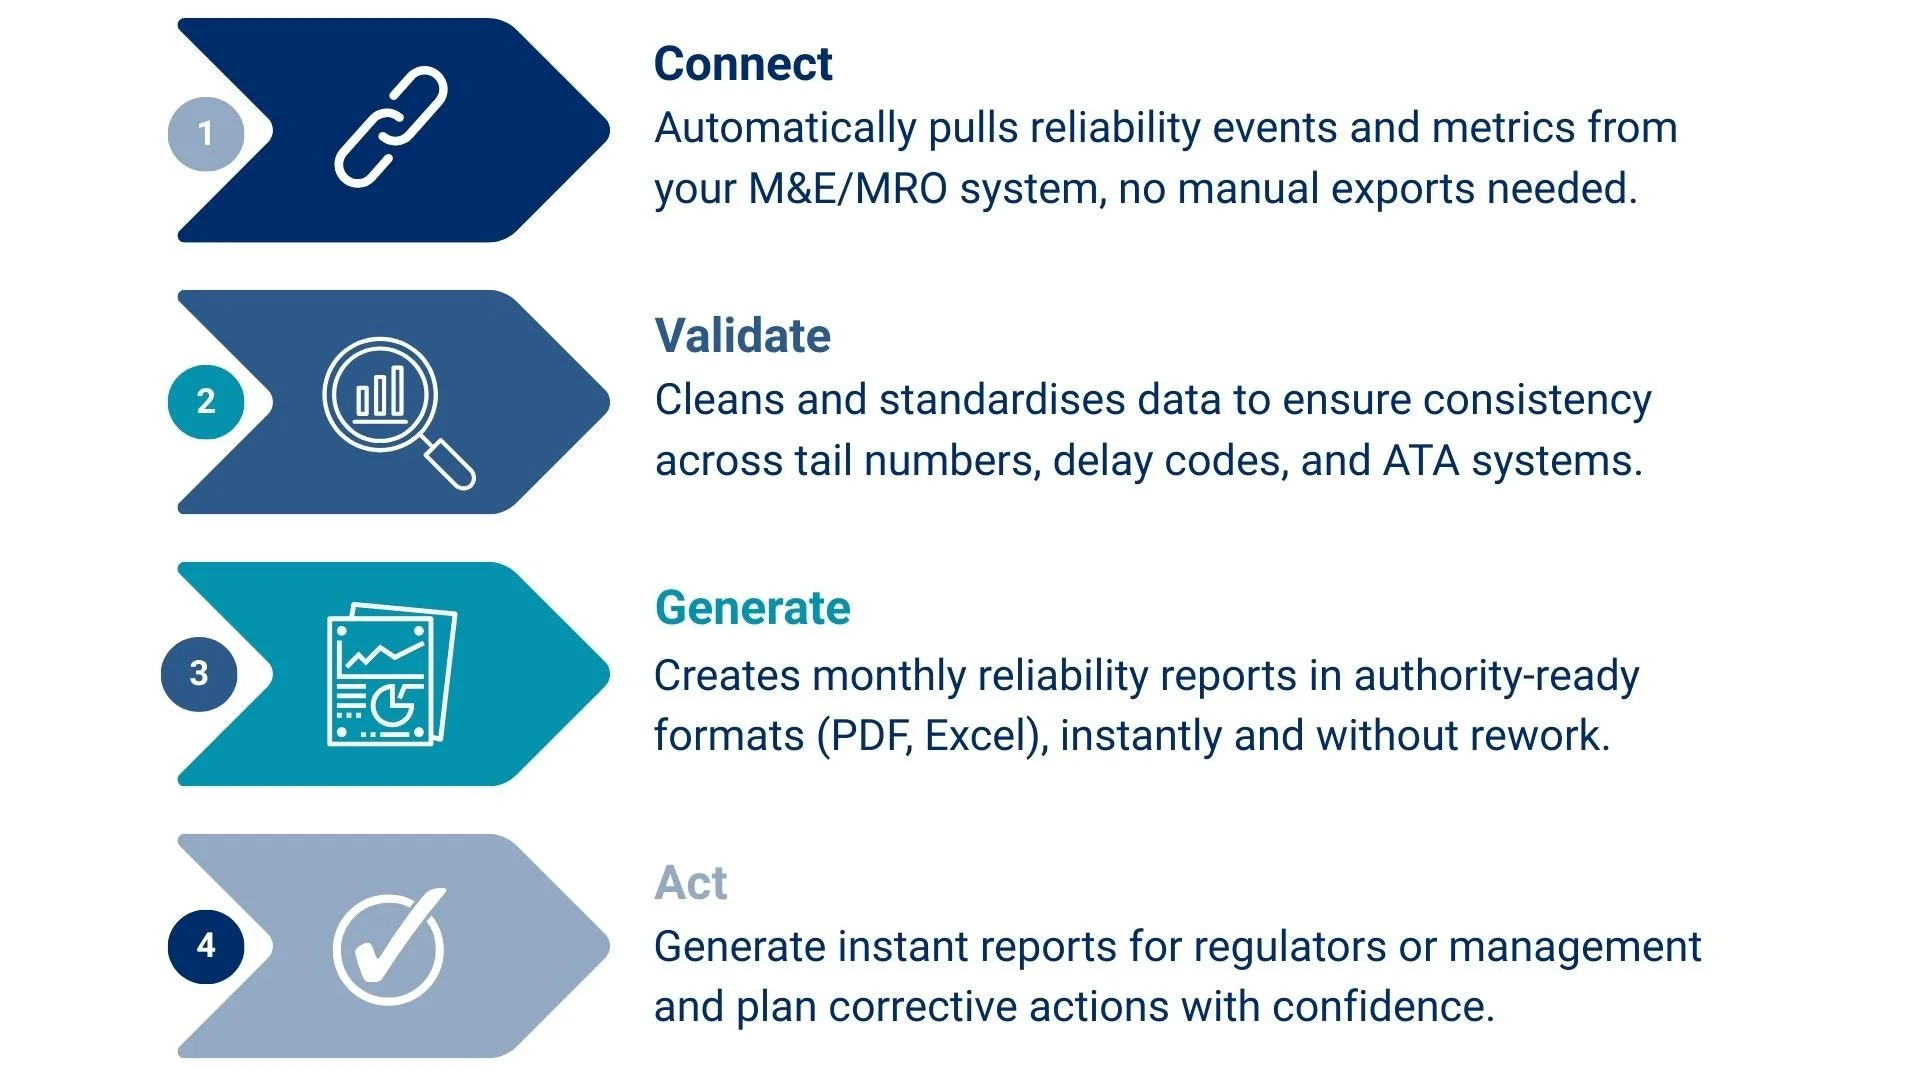
One-Click Reports
Generate monthly fleet reliability reports instantly.


Customizable Metrics
MTBF, MTBUR, unscheduled removals, dispatch reliability.
Direct Integration
Pulls data from M&E/MRO and ops systems.

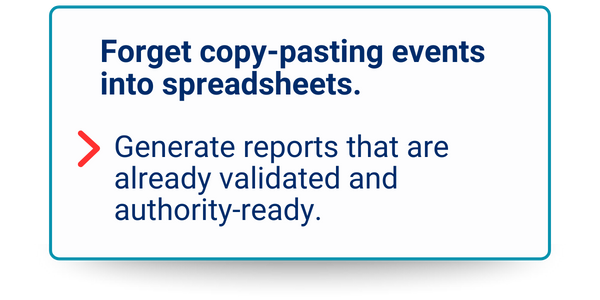
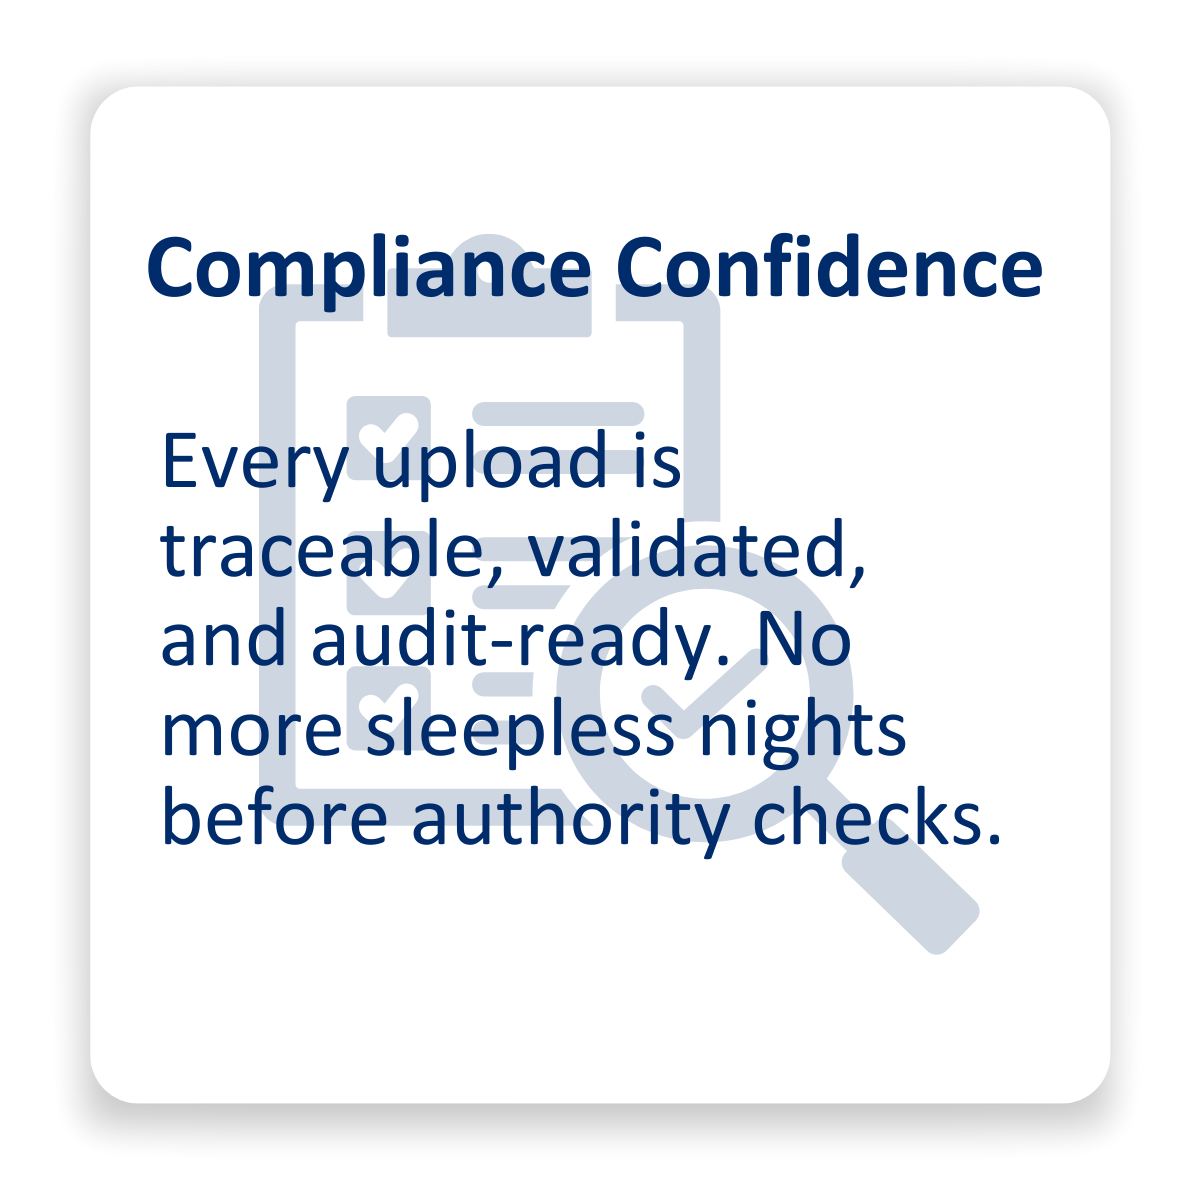
Standardized Formats
Authority-compliant reports every time.

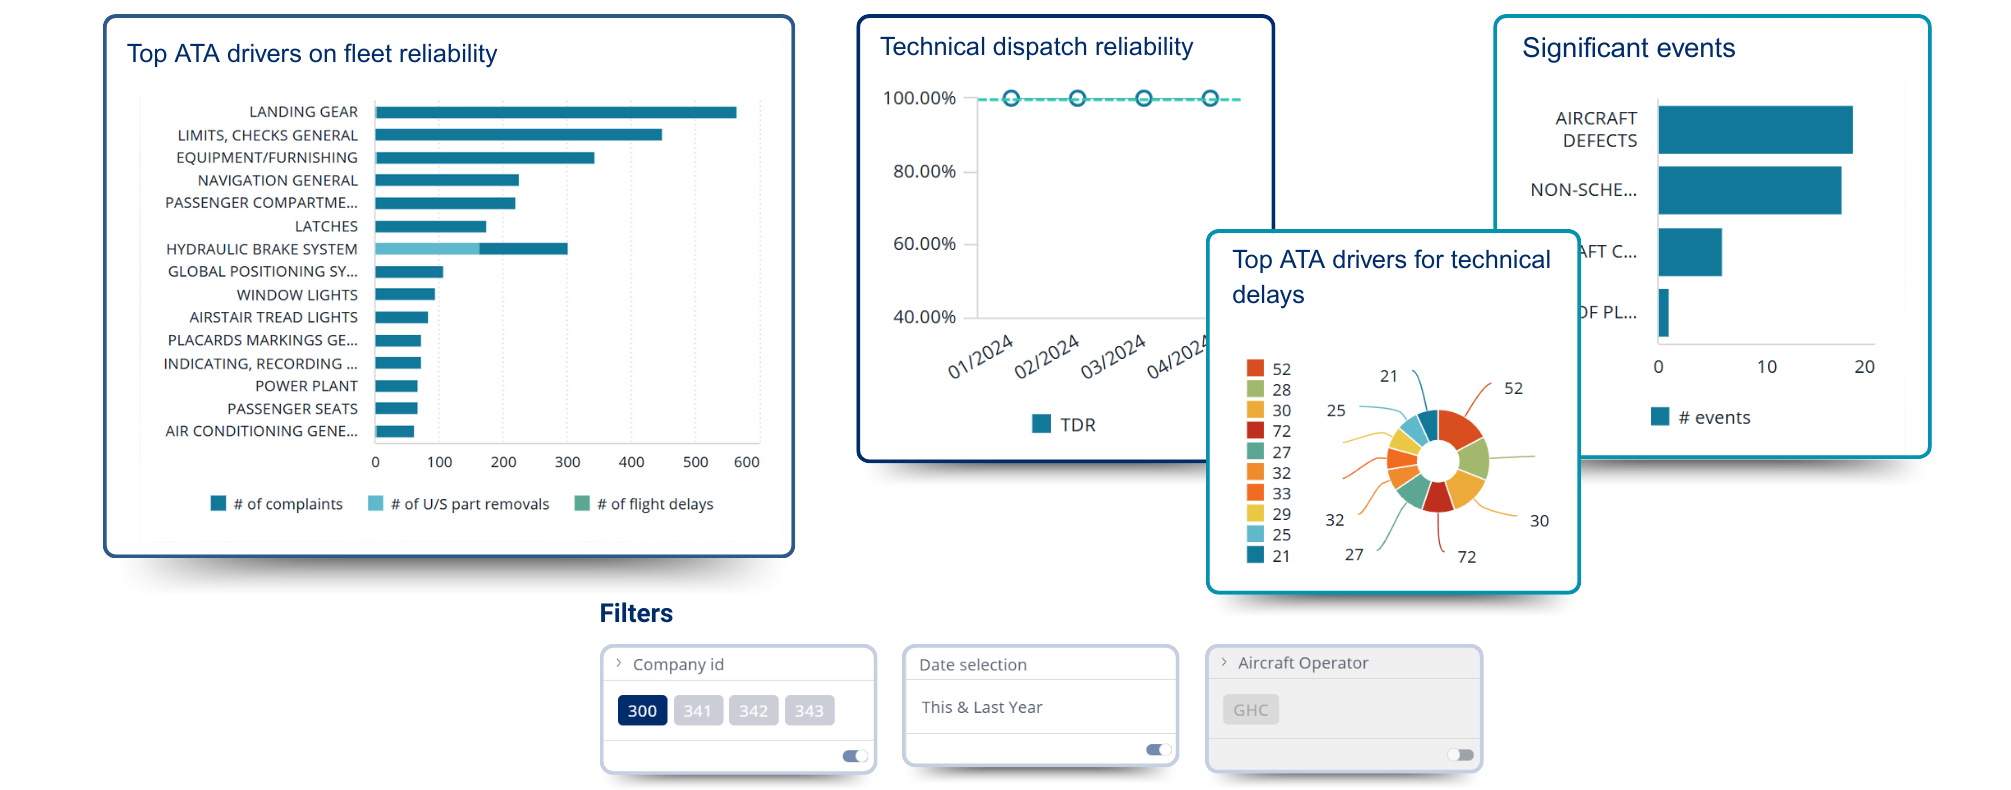
From Raw Data to Reliable Insights
The app automates the full reporting chain: from data pull to final report.
Why Reliability Teams Rely on It
Automated reporting that saves time, ensures consistency, and strengthens compliance.


Ole Holmsten, Head of Engineering at Norse
“The Reliability Reporting App cut our reporting time dramatically, giving us more time to focus on real analysis.”
See the Reporting App in Action
Watch how CAMO teams eliminate manual reliability reporting
with automated, authority-compliant outputs.
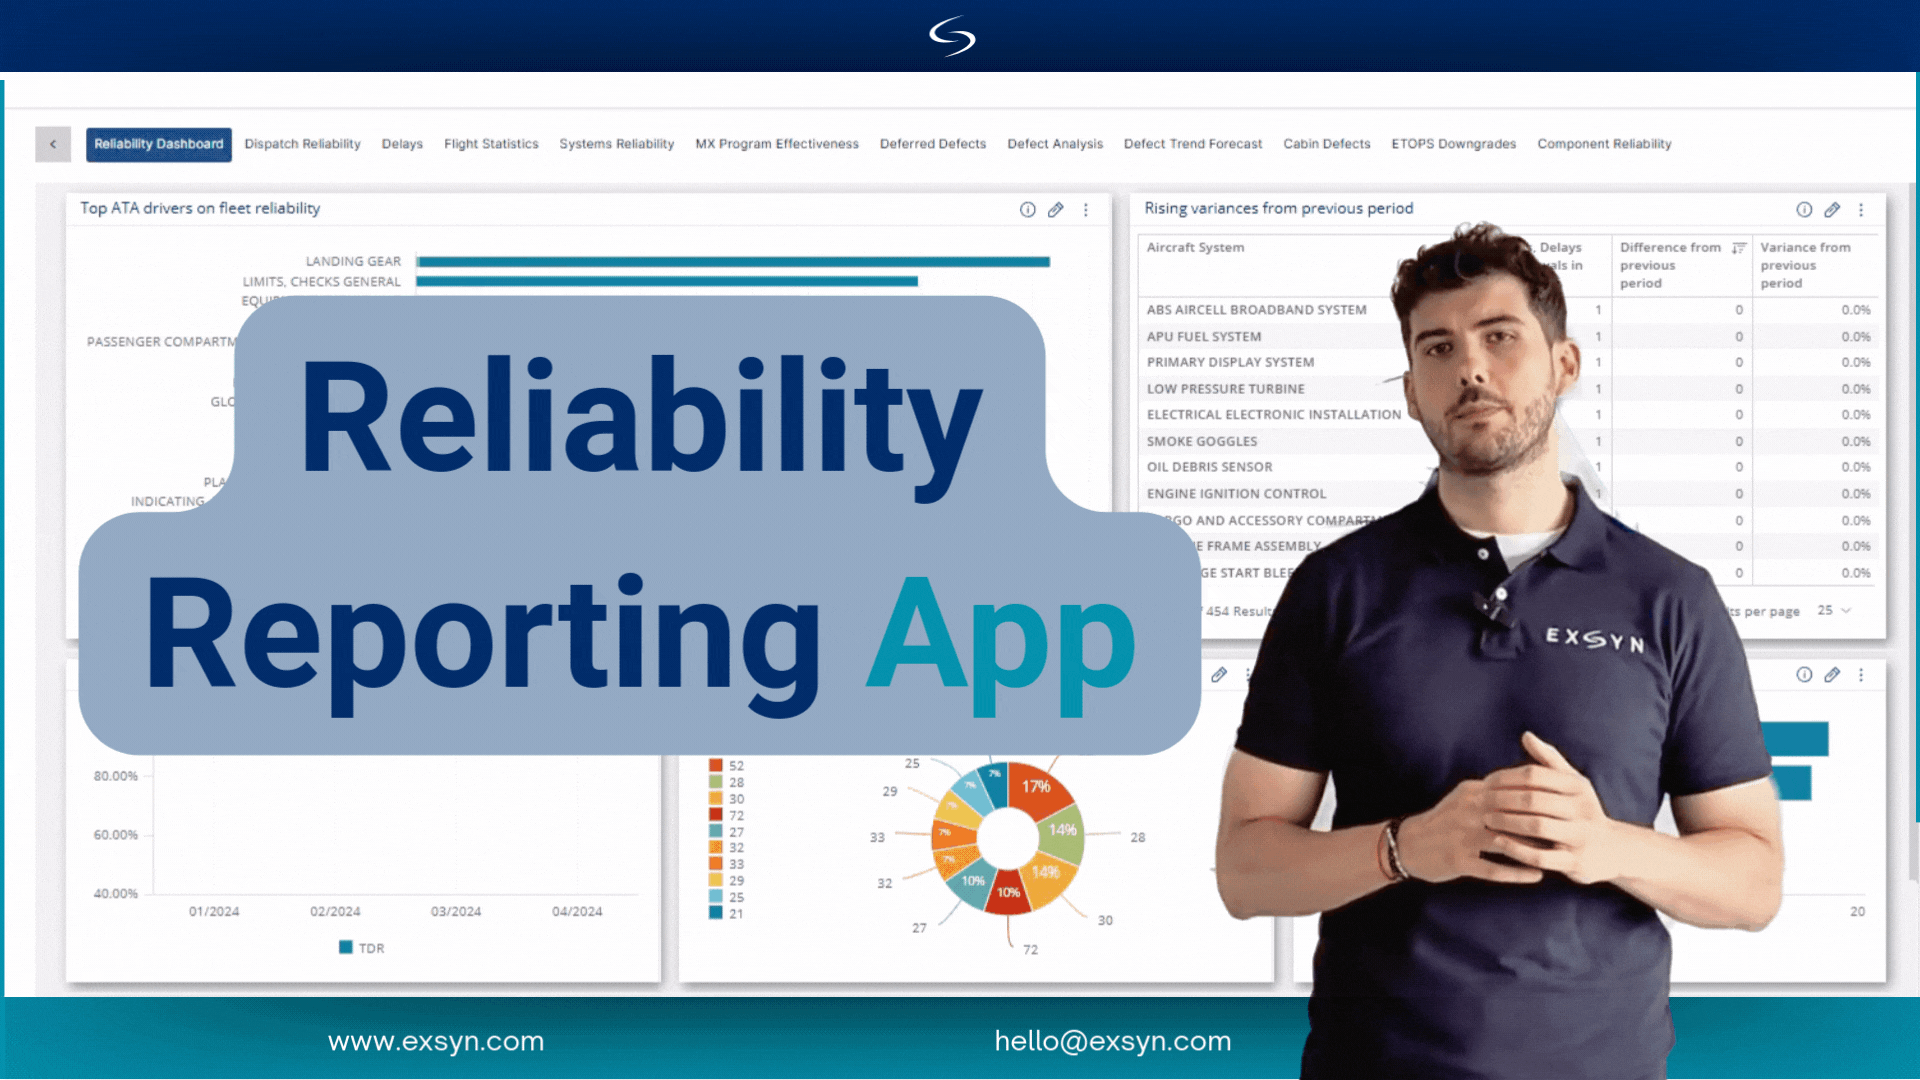
In this Feature Spotlight, we explore how CAMO teams can eliminate manual reliability reporting and move to fully automated, authority-compliant reports. Learn how engineers can use interactive dashboards to investigate delays, MEL trends, and component removals in real time, improving fleet reliability while saving time.
Ready to Stop Wasting Time on Manual Reporting?
Book a demo and see how you can automate your reports, eliminate rework, and deliver consistent compliance every month.
hello@exsyn.com | +31 (0) 20 760 8200