
Build more confidence into every aircraft logistics planning decision - Insights and Q&A
We recently hosted a live session on a problem every materials, procurement, and supply chain team knows too well. We already have the data: current stock levels, consumption history, and upcoming maintenance demand. The issue is that supplier, stock, consumption, and maintenance demand signals are not connected into one planning context.
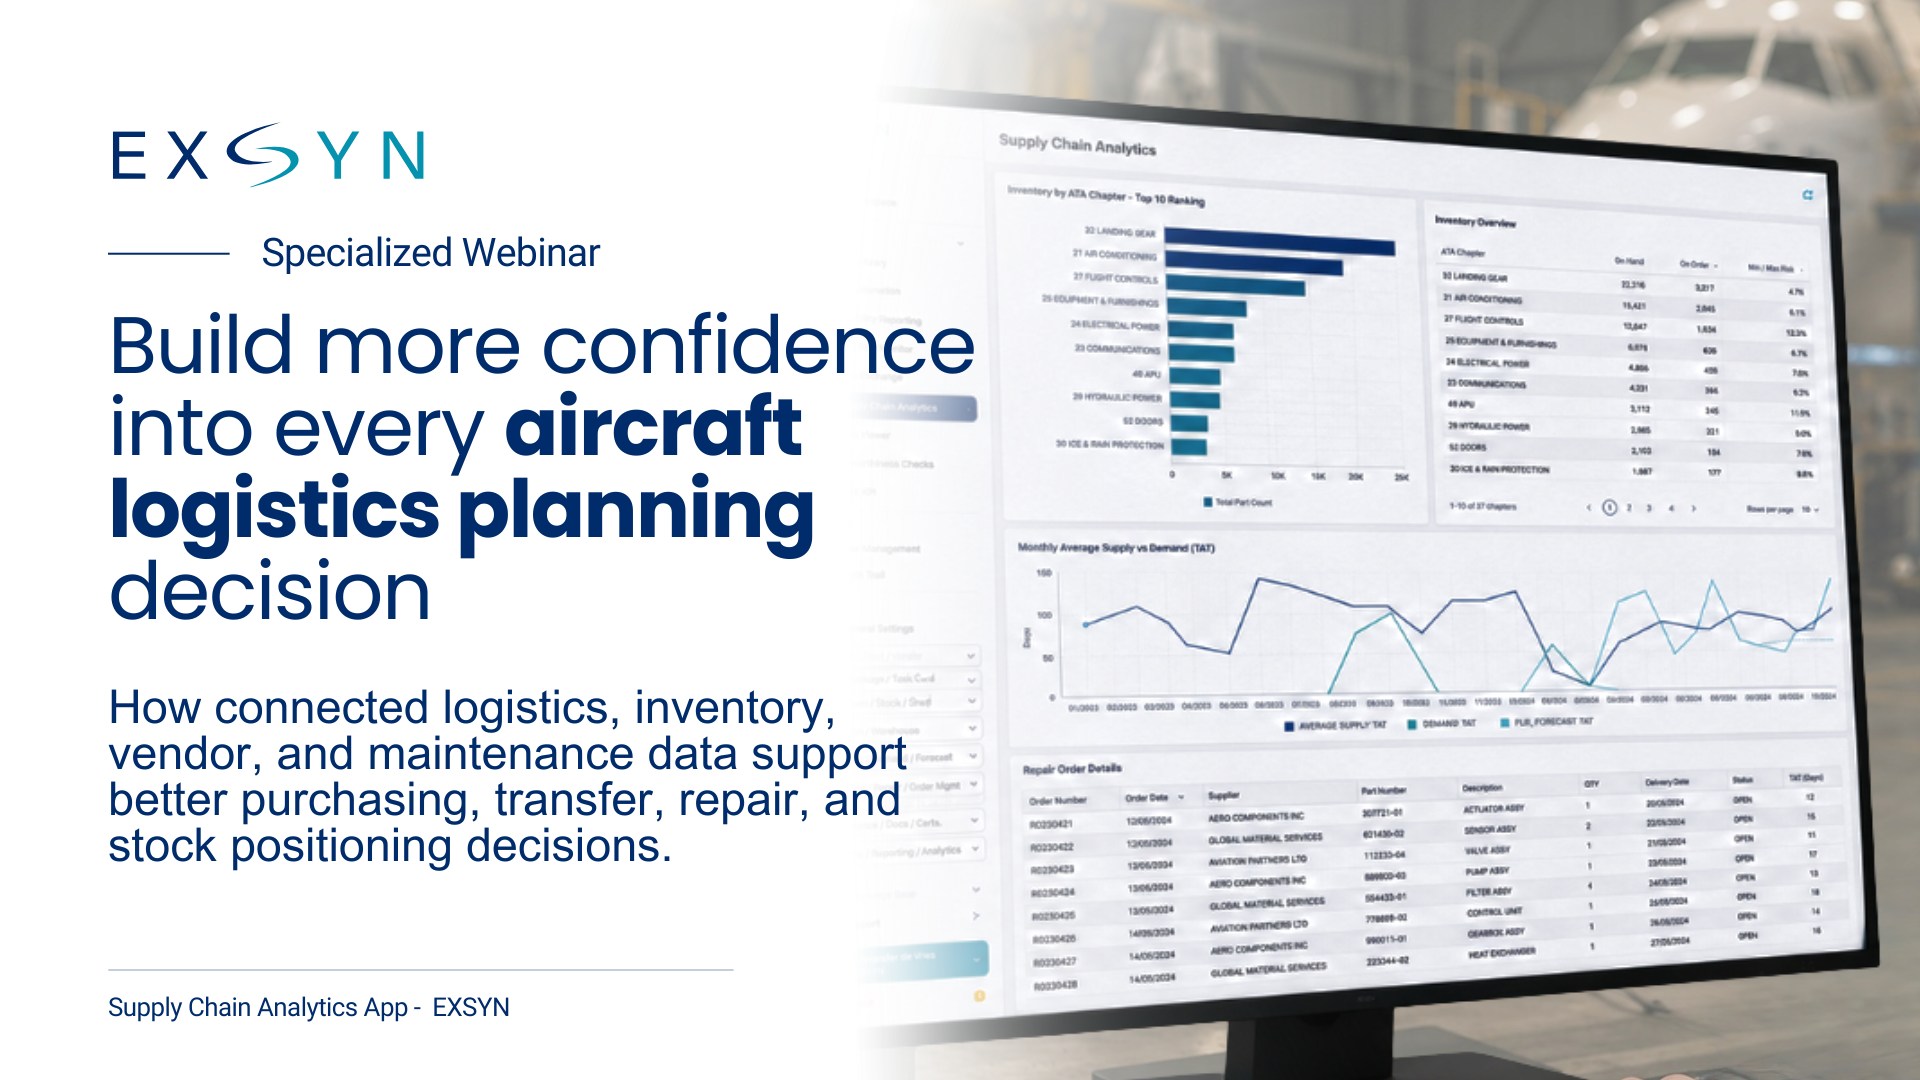
In our day-to-day operations, we see how planners were spending hours pulling context from multiple screens in our M&E systems, spreadsheets, and basic BI tools just to decide the next action on a single part. When you are managing stock across multiple line stations and dealing with ongoing supply chain delays, that manual reconciliation becomes a serious liability.
The focus of our recent webinar was practical: how do we take the data we already generate and turn it into a reliable baseline for spare parts planning?
Join the on demand session
Stop manually reconciling data and start putting your time and effort where it's more valuable. Transform your existing data into a connected planning view, reducing guesswork and building confidence in your supply chain strategy.
Overcoming Data Fragmentation
Materials and supply chain teams highlighted recurring operational friction: relying on manual effort quickly becomes a liability when planners must piece context together across multiple screens just to decide the next action on a part.
If we already use an M&E system and a BI reporting tool, what is the value of adding this connected planning layer?
"The main issue is data fragmentation. An M&E system records transactions, and basic BI tools show separate dashboards. EXSYN’s unique value is connecting those signals, supplier TAT, quarantine history, current stock movement, and future maintenance demand, into one unified operational context. It eliminates the manual work of piecing that context together across multiple screens."
Connecting these operational signals ensures that the planner does not have to rebuild the full picture manually every time they need to make a critical call.
Vendor Performance
The first section of our webinar focused on the supply side. When an order is late, everyone on the hangar floor feels the impact. But the real operational question is whether that delay was a one-off or a repeating pattern we should have caught weeks earlier in the data.
Materials teams need a structured view that connects supplier Turn Around Time (TAT), quarantine history, and AOG-critical delays, so they can see which supplier conversations need attention first.
What are the criteria used to benchmark vendor performance? Is it measured against the accepted target date or actual delivery?
"Vendor performance is based on the actual Turn Around Time (TAT). It compares the exact date and time an order is created against when it is received in the customer warehouse (using the incoming goods inspection or shipment acknowledgement timestamp). With the recently introduced metrics, we also show when there is a target date defined, and if the order was delivered within the target date as an on-time or late order."
Is time spent in quarantine taken into consideration when establishing a vendor's delivery performance?
"Yes, it is. When a part moves into quarantine, the receiving timestamp is not yet complete. The final incoming inspection timestamp is only recorded, and used for the TAT calculation, once the part is officially released from quarantine."
The emphasis remained consistent: tracking these patterns across OTD, OTIF, and quarantine status helps teams spot creeping turnaround times and isolate bottlenecks early.
Inventory Hidden Costs
The second section moved from external suppliers to internal inventory behavior. We had to ask ourselves: is our inventory value growing because of a deliberate operational strategy, or are we leaking money through hidden costs?
To answer that, teams need to connect purchasing activity, consumption history, scrapping patterns, and active material loans into one planning context.
When evaluating inventory behavior, can the app highlight if an increase in inventory value is tied to a specific aircraft or a specific maintenance base?
"Yes. The Purchase and Consumption dashboard breaks down where material spend and consumption are happening, allowing you to trace inventory value fluctuations directly to individual maintenance bases or specific aircraft in your fleet."
What about uncovering hidden inventory costs, like repeating scrap issues or active loans? Will the app uncover those that finance teams might not see?
"Absolutely. The Scrap and Loan dashboards specifically target hidden costs. They distinguish between raw volume and monetary value (e.g., scrapping hundreds of cheap packings versus a few expensive pitot tubes) and show the total accumulated financial value of all open tool and part loans, giving finance and materials teams clear business cases for intervention."
These clear insights help organizations ensure their purchasing aligns perfectly with their actual operational consumption.
Spares Demand Forecasting
The final section of the webinar focused on the shift from reacting to anticipating, and was also where most questions focused. That transition happens when you successfully bring together upcoming scheduled maintenance, station-level availability, lead times, and expected unscheduled events.
Our core operational logic is "transfer before purchase." We needed a system that looks at surplus stock at other bases or pool exchange options before prompting us to raise a new purchase order.
For the spares demand forecast, how exactly does the machine learning algorithm balance historical consumption data against upcoming scheduled maintenance events?
"The algorithm brings multiple layers together: it looks at historic consumption rates on specific bases, maps out the upcoming scheduled maintenance activities, and overlays expected unscheduled maintenance (driven by historical data). It synthesizes all this to produce a recommended material action per base."
How does the app factor in alternate parts availability when assessing if a potential shortage is a real operational risk or a coverable one?
"Alternate part availability is built into the forecasting workflow. Often, a planner might see a shortage for a specific part number, but the system checks if an approved alternate or interchangeable part is available elsewhere in the network, helping to clarify if the shortage is a hard stop or easily coverable."
When applying the "transfer before purchase" logic, does the app factor in the logistical cost and lead time of transferring a part from another base versus buying it locally?
"The forecasting engine takes into account lead times and station-level inventory availability. While the core logic prompts planners to look at surplus stock at other bases first, the planner utilizes the Spares Daily Viewer to look at the exact timing requirements and underlying calculations to make the final, most cost-effective call."
Does the app handle procurement workflows, like converting Part Requests to orders, or does the operational system remain the source of the transaction?
"The operational system remains the source of the transaction. The Supply Chain Analytics App is purely a data analytics and planning layer. It does not replace operational process workflows, but rather sits on top of them to help teams make better decisions before executing those transactions."
2026 Perspective: Supply Chain Resilience Requires Connected Context
The concluding message from the session was direct:
The system does not make decisions for the planner; it does the heavy lifting of reconciling the data. Spare parts planning is much stronger when supplier performance, inventory activity, and future demand are treated as connected parts of the same workflow. By connecting these signals, we have significantly reduced manual guesswork and gained confidence in the numbers driving our material plans.